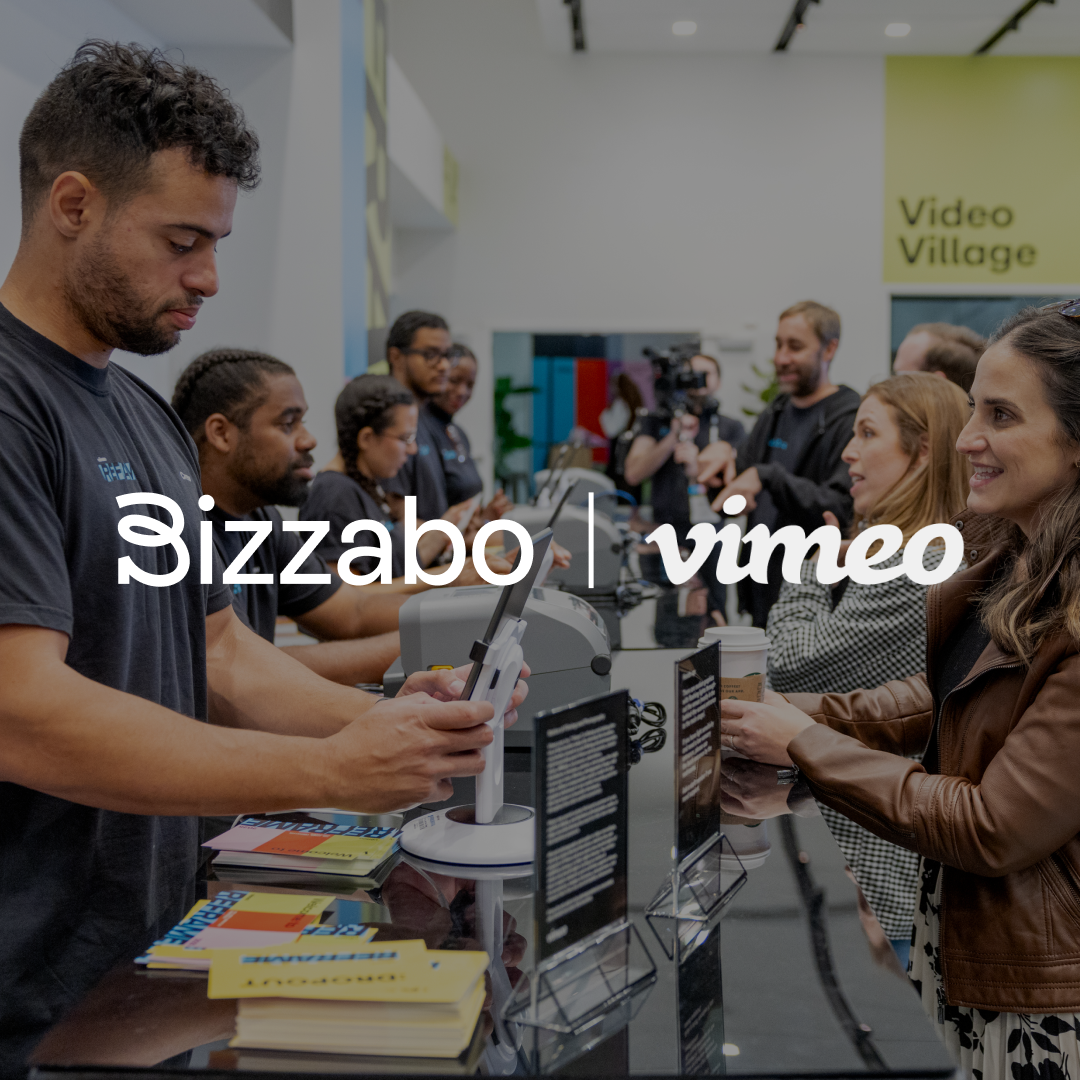

For the Vimeo team, evolving their flagship event has been a three-year journey. Maya Sykes, Director of Integrated Marketing, and Dani Daubaras, Senior Events Experience Manager, have refined the experience each year, transitioning from a virtual-only event to a hybrid format centered on community and connection.
But for Year 3, they wanted more concrete data. They wanted to truly understand how people were interacting with the event.
Want the whole story? Read the full case study here.
From anecdotes to real insights
The first year, Outside the Frame, was entirely virtual. The second year, REFRAME 2024, brought the community together with an in-person and virtual format. People loved the event, but the team still relied heavily on anecdotal feedback. Maya and Dani couldn’t see the full picture.
“REFRAME 2024 was a big success, but we knew we were missing something: real data,” says Maya. “We wanted to see dwell time, which sessions people actually attended, and how they moved through the event space. Instead, we were relying on anecdotes when what we really needed were hard numbers.”
Heading into 2025, the team wanted to change that.
Why dwell time mattered
To get the visibility they’d been missing, Maya and Dani brought in Klik SmartBadges™. Klik is Bizzabo’s onsite engagement tool, combining a small wearable device with the attendee badge. It helps organizers see how people move through the space, who they connect with, and which sessions they join. One of its most helpful features is real-time heatmapping, which shows exactly how attendees flow through the event.
This mattered because REFRAME 2025 was thoughtfully structured:
- Sessions capped at 25 minutes (20 minutes of content and 5 for Q&A)
- A main stage for keynotes
- Three breakout stages
- An experiential area with demos and activations
The team wanted to know: Were people staying for full sessions? Were attendees bouncing between stages? Which areas were drawing the most engagement?
Before Klik, they could only guess. But now, they could watch attendee behavior unfold in real time.

What the data revealed
Once the SmartBadges were in use, the numbers began to tell a very clear story.
Across every stage, average dwell time was 20 minutes, which is remarkably strong for fast-paced sessions.
Maya and Dani could also see how REFRAME compared to other events using Klik.
“Our event is only a one-day event, and other people have used Klik for multi-day events,” Maya shared. “When we looked at the data, we were still on par with the number of connections people made in our one day versus a two- or three-day event. I would say that’s outstanding.”
In other words, attendee engagement wasn’t just healthy. It was competitive with events that had double or triple the time.
This was the kind of insight the team could never have surfaced before.
Creating a testing roadmap for the future
Now that they finally had hard data, Maya and Dani could start planning more strategically for future years.
Because dwell time, session attendance, attendee movement, and networking patterns were visible, they could begin building a testing roadmap informed by data instead of intuition.
“It offers a lot more data points than we can even know about,” Dani said. “In the future, we would even do a bit more research on the forefront to make sure we get back as much as we possibly can.”
Instead of guessing what might improve attendee experience, they can now test things like:
- Session length
- Stage placement
- Flow of foot traffic
- Activation design
- Networking opportunities
The 2025 data created a baseline that they can iterate on for years to come.
A more informed path forward
By investing in Klik and prioritizing dwell time data, the Vimeo team filled the gaps that had previously limited their visibility. And with a benchmark in place, Maya and Dani now have a clearer idea of what’s working, what to adjust, and what to test next.
The result is an event strategy grounded in real behavior rather than assumptions and a roadmap that only gets sharper with time.
Ready to see what that could look like for your team?
Request a demo of Bizzabo and Klik SmartBadges to explore how we can support your next flagship event.